
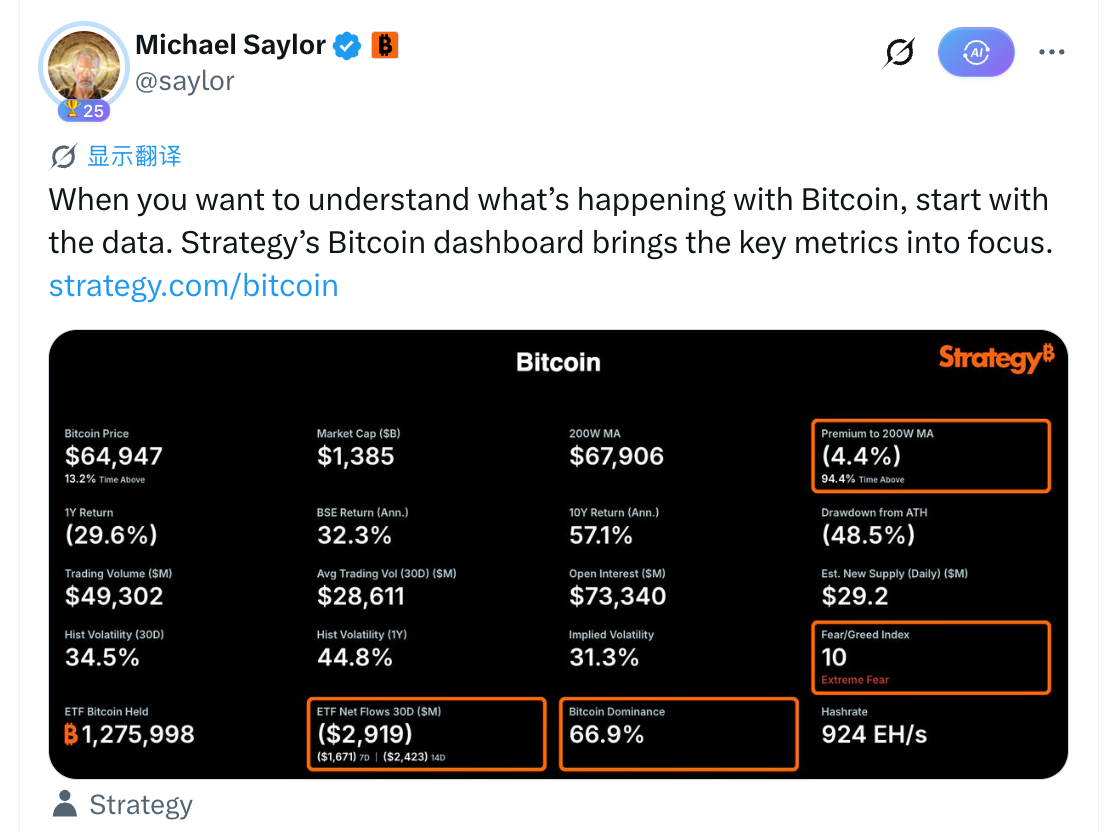
On November 16, 2026, Michael Saylor shared a screenshot of Strategy’s Bitcoin dashboard and highlighted four areas: the 200-week moving average, spot ETF flows, market sentiment and Bitcoin’s share of total crypto market value. The figures reported that day describe a weak market, but they do not, on their own, establish that Bitcoin had reached a bottom.
Price and fund flows
The dashboard showed Bitcoin at $64,947, below its $67,906 200-week moving average—a reported deviation of −4.4%. It also stated that Bitcoin had traded above that average 94.4% of the time, implying 5.6% below it. A moving average measures historical prices; it is not a direct measure of holders’ acquisition costs or proof of undervaluation.
Strategy’s spot Bitcoin ETF flow figures showed net outflows of $2.919 billion over 30 days, including $2.423 billion over 14 days and $1.671 billion over seven days. The shorter windows suggest outflows were concentrated recently. ETF flows, however, do not measure all institutional Bitcoin activity.

Sentiment and market structure
The dashboard’s Fear and Greed Index read 10, labelled “Extreme Fear,” while Bitcoin futures open interest stood at $73.34 billion. Open interest measures outstanding contracts, not whether traders are predominantly positioned for a rise or a fall.
Bitcoin dominance—the asset’s share of total crypto market value—was 66.9%. The dashboard also put Bitcoin 48.5% below its all-time high, with a −29.6% one-year return. Rising dominance alongside a falling Bitcoin price is consistent with other cryptoassets losing relative market value. It does not, by itself, demonstrate that capital moved from those assets into Bitcoin.
Taken together, the November 16 figures provide separate views of price trend, ETF flows, sentiment and relative market value. None identifies a price floor, and the dashboard snapshot alone cannot establish what caused the moves.