In research published on November 11, 2026, 0d Labs CEO matteo examined whether Hyperliquid’s long-tail order books had become less competitive—and whether conditions for smaller market makers might help explain the change. The analysis draws on more than 18 months of order-book records collected while 0d Labs traded the relevant markets. It documents a decline in near-price liquidity, but does not establish a single cause.
Comparing the same assets across venues
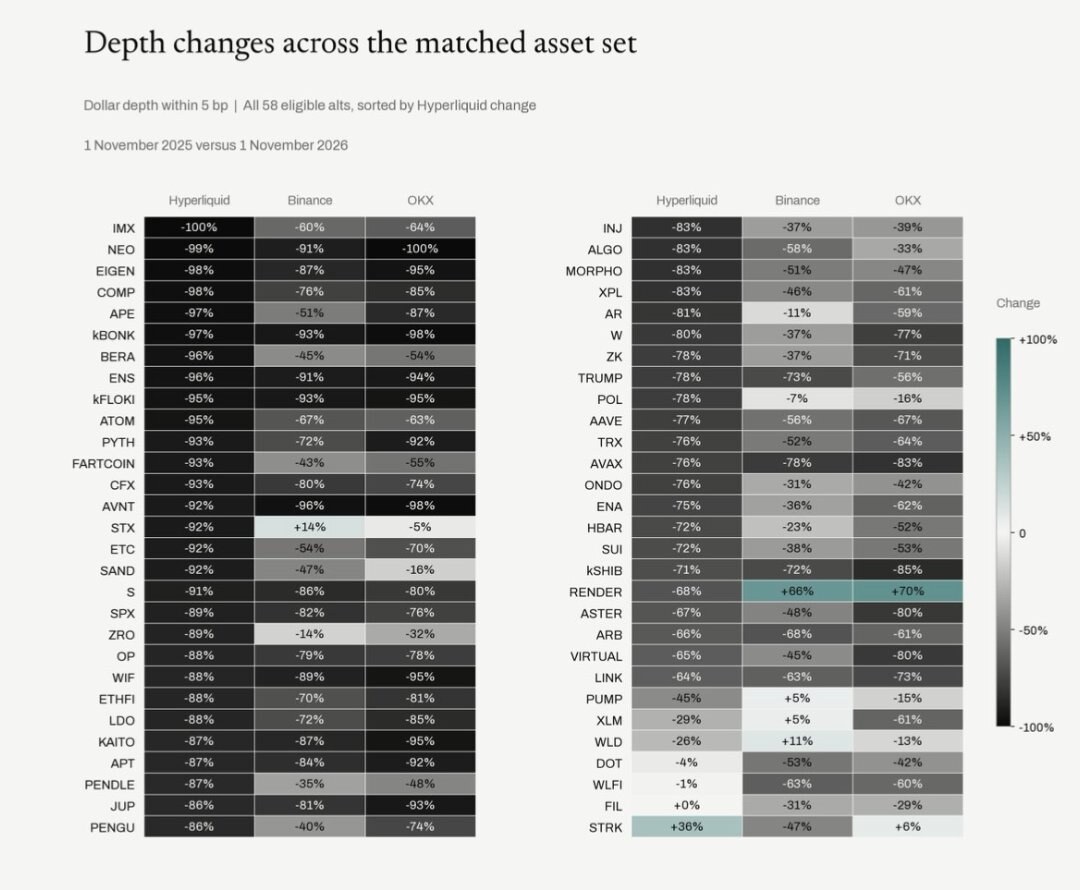
To separate a Hyperliquid-specific change from a broader market decline, matteo selected 86 assets traded on both Hyperliquid and Binance between November 1, 2025, and November 1, 2026, with maximum leverage below 10×. Among 38 markets comparable at a distance of 10 basis points (bps) from the mid-price, median US-dollar-denominated depth fell 82% on Hyperliquid, 61% on Binance and 78% on OKX.
A falling token price can itself reduce dollar-denominated depth. Matteo therefore also calculated, market by market, the ratio of Hyperliquid depth to Binance depth. Within 5 bps of the mid-price, that ratio’s median fell 57.5% over the year. This is the median change in individual market ratios, not a ratio of venue-wide medians.
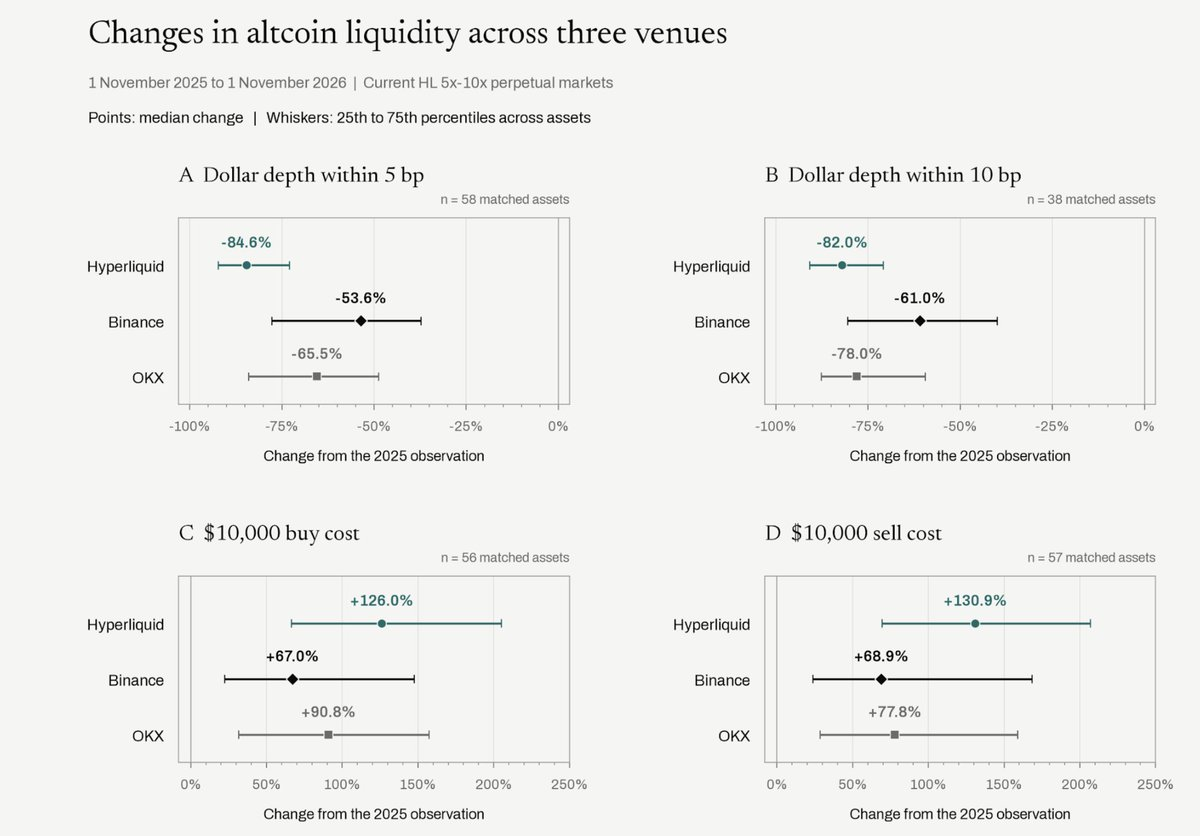
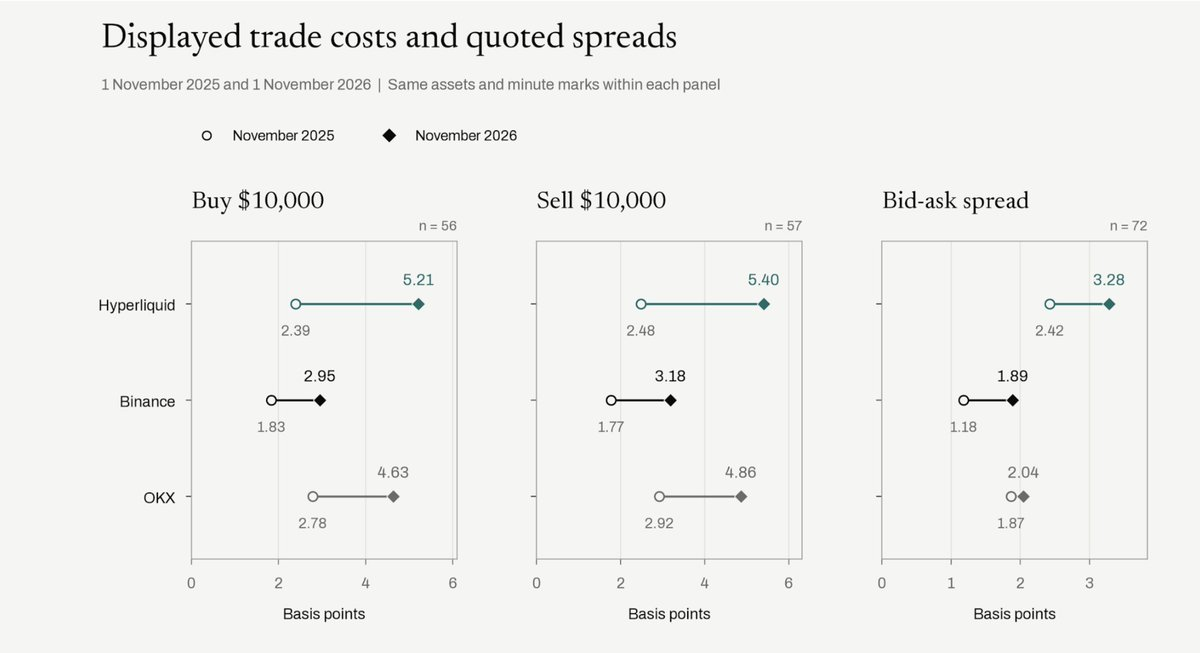
In the later sample period, displayed orders implied a median cost of 5.21 bps to buy $10,000 of an asset on Hyperliquid, versus 2.95 bps on Binance—$5.21 and $2.95 respectively, before fees. Bid-ask spreads complicate the comparison: Binance’s spread widened more in relative terms, although it started narrower and remained narrower.
Where did the quoted tokens go?
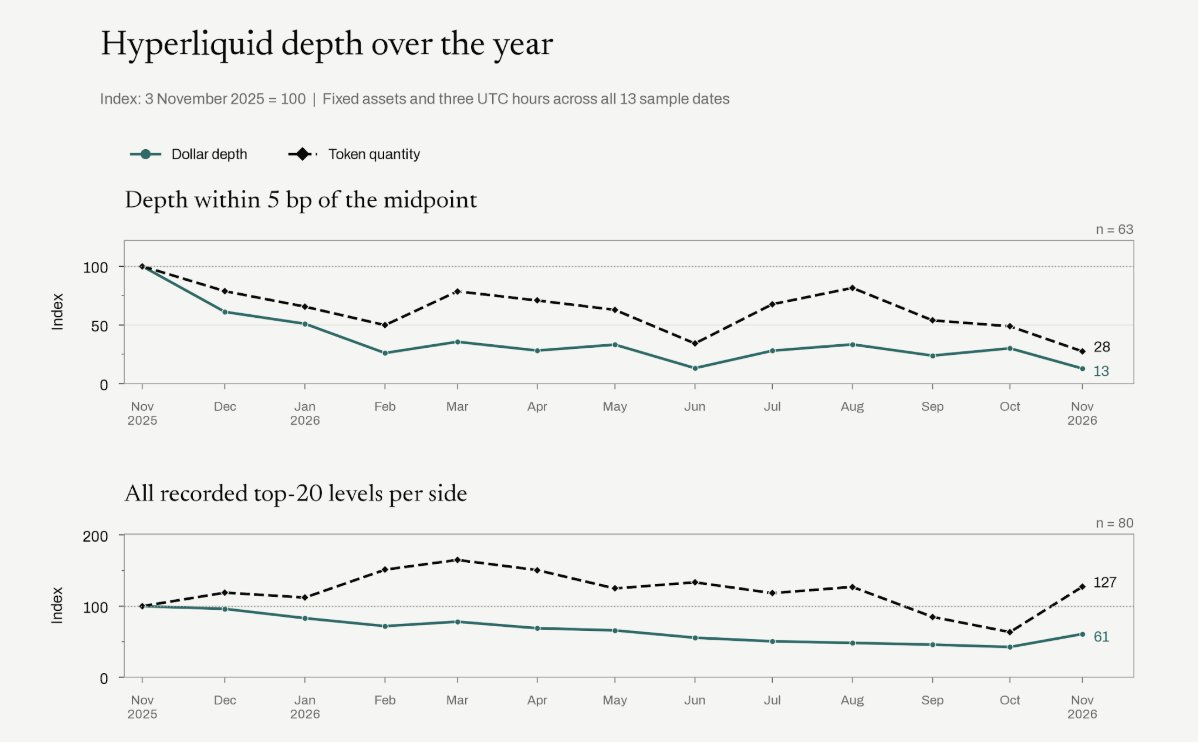
For a separate Hyperliquid time series, matteo held the asset set and observation windows constant across 13 sampling dates. The sample covered 63 markets within 5 bps and 80 markets across the recorded top 20 order-book levels. These stricter selections mean its endpoint figures should not be substituted for the cross-venue comparison.
With each market’s November 2025 reading indexed to 100, the median 5-bps dollar-depth index stood at about 13 one year later; the quoted-token-quantity index stood at about 28. The fall in token quantity shows that price declines alone cannot account for the loss of orders close to the mid-price.
Across the recorded top 20 levels, however, the median dollar-depth index ended at 61 and the token-quantity index at 127. In other words, the typical market had more tokens quoted across that wider portion of the book, even as quotes nearest the trading price diminished. Matteo also reports some improvement in overall depth during the preceding six months, mainly farther from the market price.
Competition, concentration and an unresolved cause
Matteo grouped main accounts with their explicitly linked subaccounts before comparing market-maker activity. Across the same 80 markets in one complete week a year earlier and one recent complete week, the median share of market-maker volume attributable to the largest account group fell from 25.2% to 14.6%. That finding does not support attributing the year-long depth decline to one firm taking over trading volume.
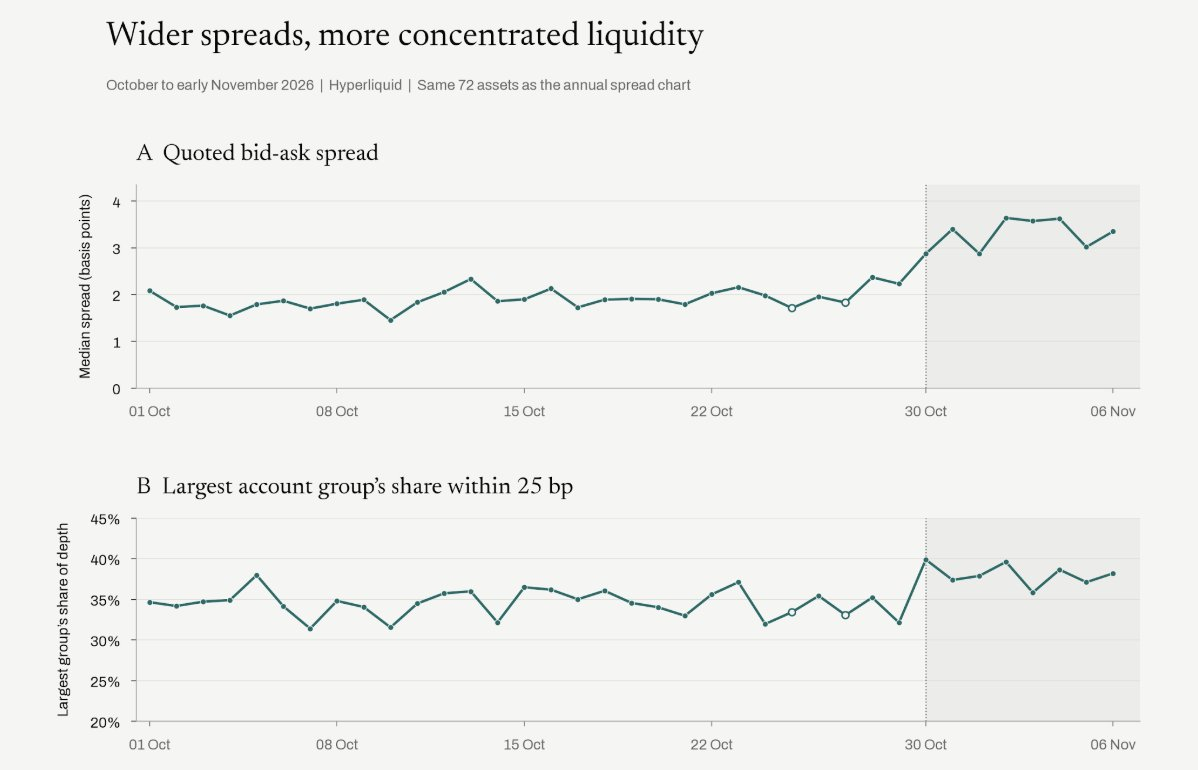
The more recent quoting data point in a different direction. Across 72 assets, comparing October 8–14 with October 31–November 6, 2026, the median largest-account-group share of quotes within 25 bps rose from 34.5% to 38.6%, while the median quoted spread widened from 2.13 to 3.55 bps. The average number of account groups quoting at least $1,000 on each side within that range fell from 7.64 to 6.39. Matteo reports a decline in 58 of the 72 markets even when token prices are held constant.
Those changes coincide with complaints matteo heard from traders about priority fees and congestion. The account also reports their claim that Wintermute dominated Read Priority Fees; it does not independently establish that claim. Matteo notes a Binance security event on October 29 within the observation window and a large liquidity provider sharply reducing quotes around November 3. The curves alone cannot distinguish those possible influences or establish that priority fees or congestion caused the change.
The cost of keeping smaller market makers active
For 54 account groups, matteo calculated historical volume-weighted maker fees. The lowest-volume quartile paid an average of 0.961 bps, while the highest-volume quartile received an average rebate of 0.236 bps: a gap of roughly 1.20 bps before hedging costs or adverse fills. This is a measurable cost difference, though the study does not isolate its effect on quoted depth.
The research also examines Hyperliquid’s congestion rule, under which an address’s allocation is based on its weighted maker share on the preceding UTC day. During heavy congestion, it can use up to twice its share of block space. Matteo argues that this may disadvantage a participant that needs capacity to build the very trading share used to determine its capacity.
In a November 10, 2026, sample of 256 HIP-4 contracts, four professional market-making wallets supplied 47% of visible depth within 25 bps of the mid-price. Matteo says traders reported difficulty posting orders during congestion. The sample identifies a potential dependency for these still-small markets; it does not demonstrate how HIP-4 liquidity would change under a different allocation rule.
The evidence is strongest on what changed in the sampled books: Hyperliquid lost substantial near-price depth relative to Binance, and fewer account groups recently supplied meaningful nearby quotes. Whether fee tiers, congestion, individual liquidity providers or other conditions drove those changes remains unresolved.