
Glassnode’s analysis, published in translation on October 29, 2026, described a Bitcoin market caught between substantial holder supply above $85,000 and nearby buying interest below $80,000. Its price, order-book and hourly on-chain observations ran through October 27; some daily on-chain, ETF and Hyperliquid figures ran through October 25 or 26. Glassnode cautioned that recent daily data could be revised.
The analysis was written in advance of the October 28 Federal Reserve decision, although the translated report was published afterward. Its discussion of what that decision might do is therefore a dated scenario, not an account of the outcome.
Where holders and orders were concentrated
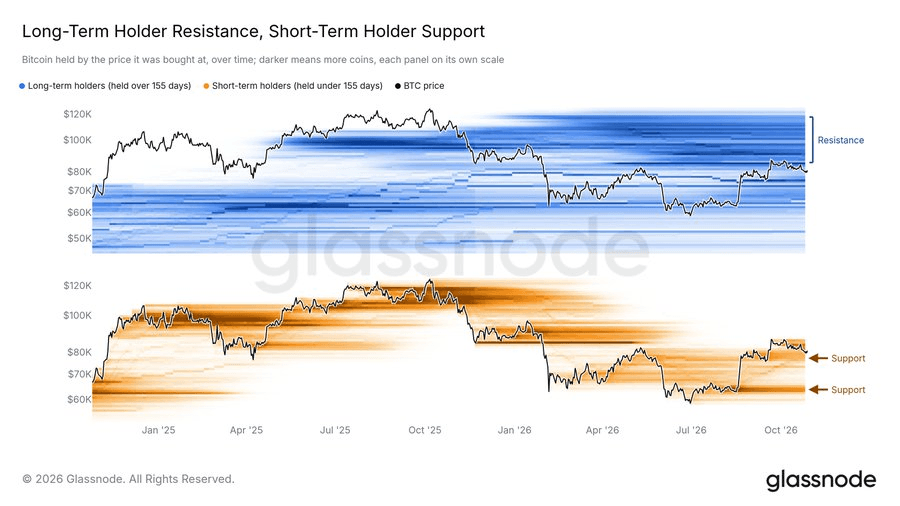
Glassnode’s cost-basis distribution groups coins by the price at which they last moved on-chain. On that measure, long-term holders—defined here as holders of more than 155 days—held roughly 4 million BTC with cost bases between $85,000 and $118,000, largely acquired in 2025. More than half of their coins had cost bases above the market price in the report. Glassnode considered selling near breakeven on a rebound toward $85,000 a possibility, not an observed outcome.
Most short-term-holder coins, by contrast, had cost bases below the market price. Their largest concentration was near $77,000, with another near $64,000, around the 2026 low. These distributions identify potential areas of holder response; they do not establish where buyers will defend the price.
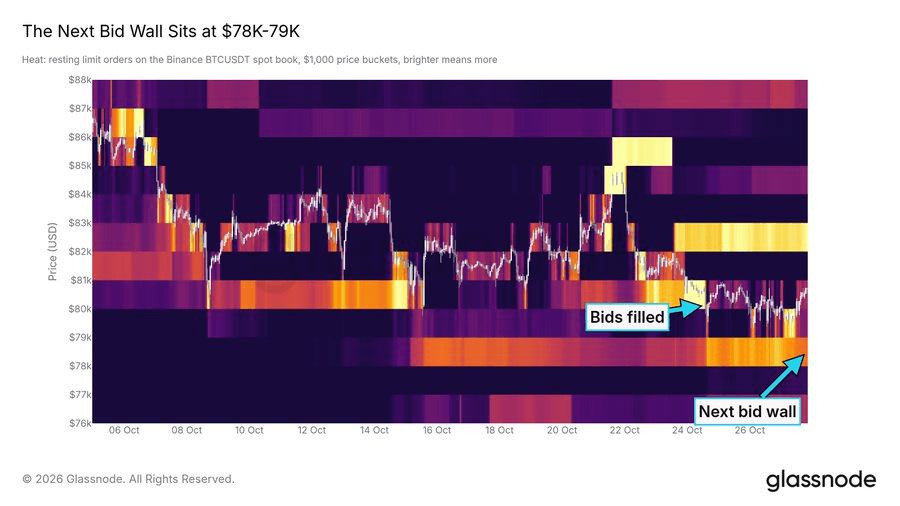
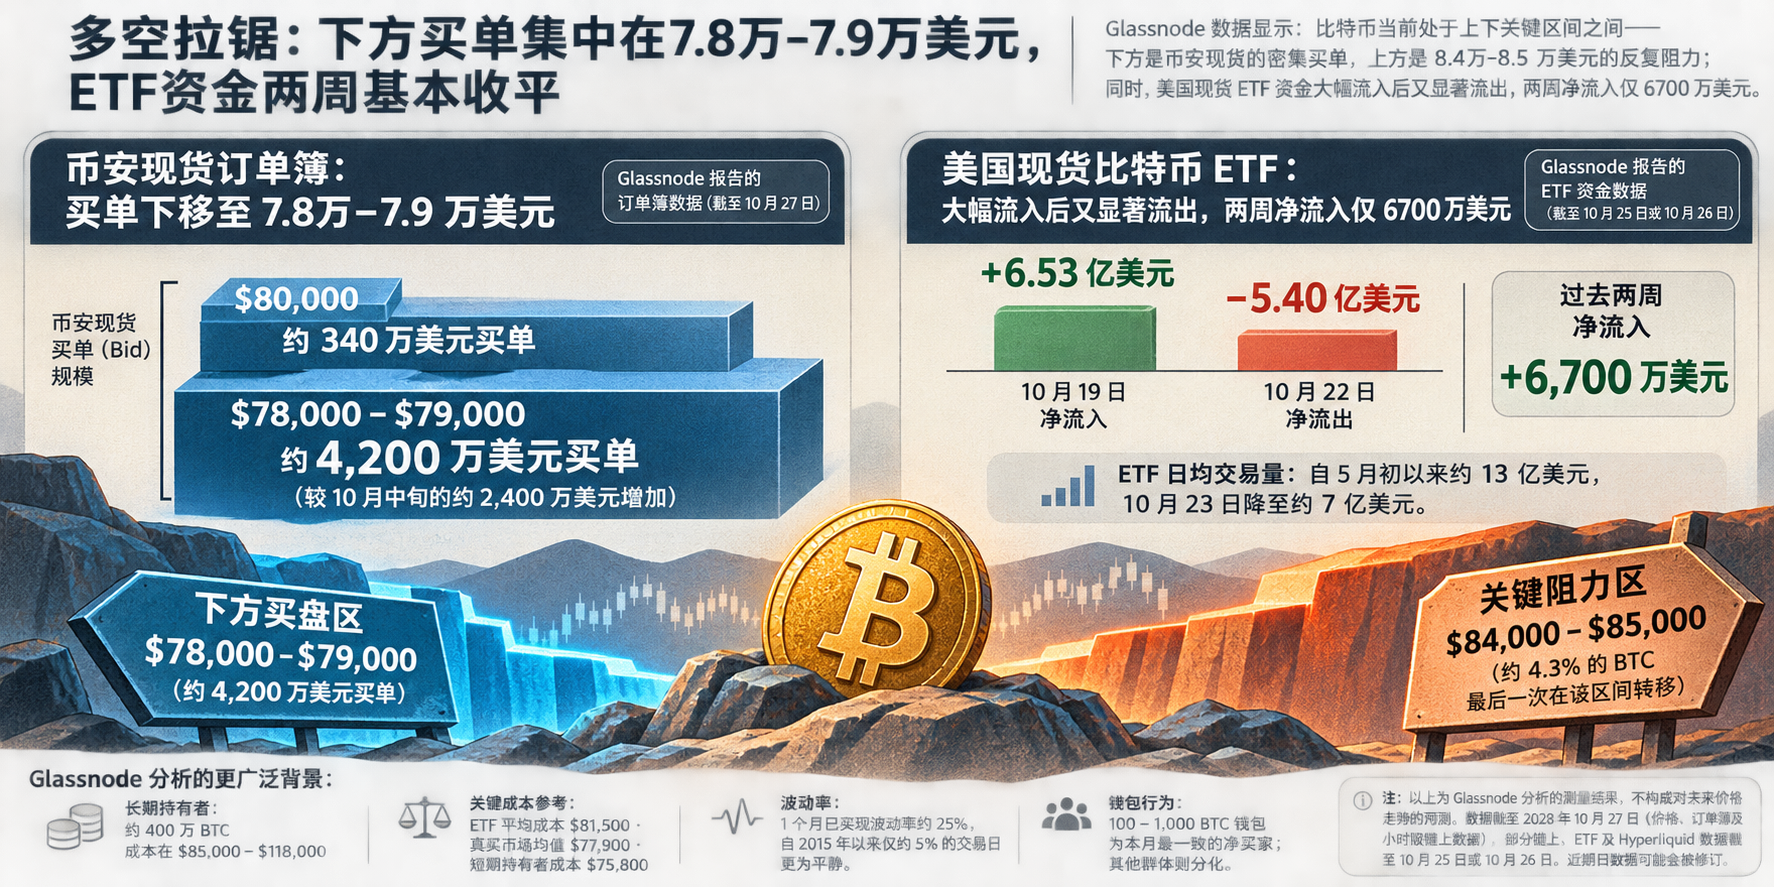
The Binance spot order book showed a different, more immediate measure of demand. Glassnode said buy orders replenished at $80,000 after an October 15 liquidity sweep were cleared by another move lower on October 24 and had not returned. About $3.4 million in bids remained at $80,000, while bids between $78,000 and $79,000 totaled about $42 million, up from approximately $24 million in mid-October. Posted orders can change or be canceled before execution.
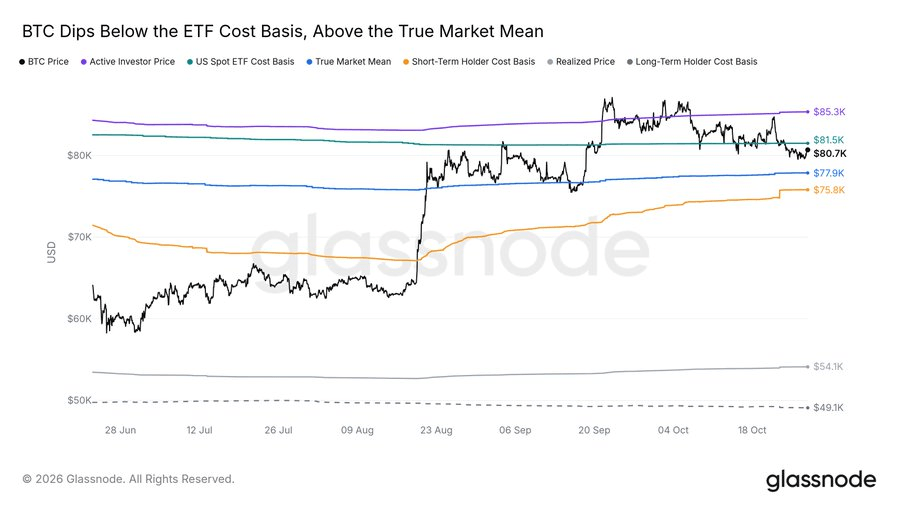
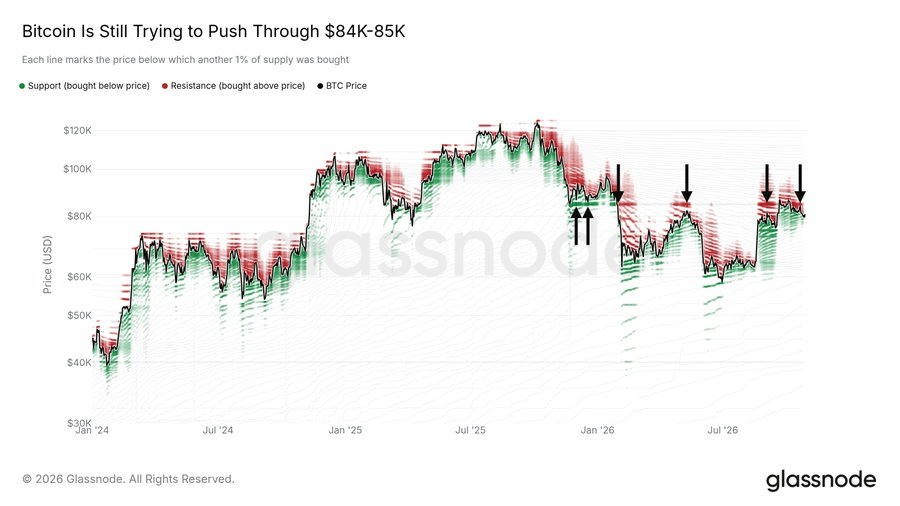
Glassnode also identified $84,000–$85,000 as recurring resistance. About 4.3% of Bitcoin had last moved on-chain in that range, but most of those transfers occurred on November 22, 2025, when one large entity moved coins between its own wallets. That makes the raw distribution a poor proxy for purchases at those prices. The range nevertheless figured in the price history cited by Glassnode: it provided support in December, failed on January 31, and later constrained rebounds in May, early September and October 21. Since January, daily closes above the range had occurred on only five days, with no run longer than three days. Bitcoin briefly exceeded it during the September high, reaching $87,100 on September 23.
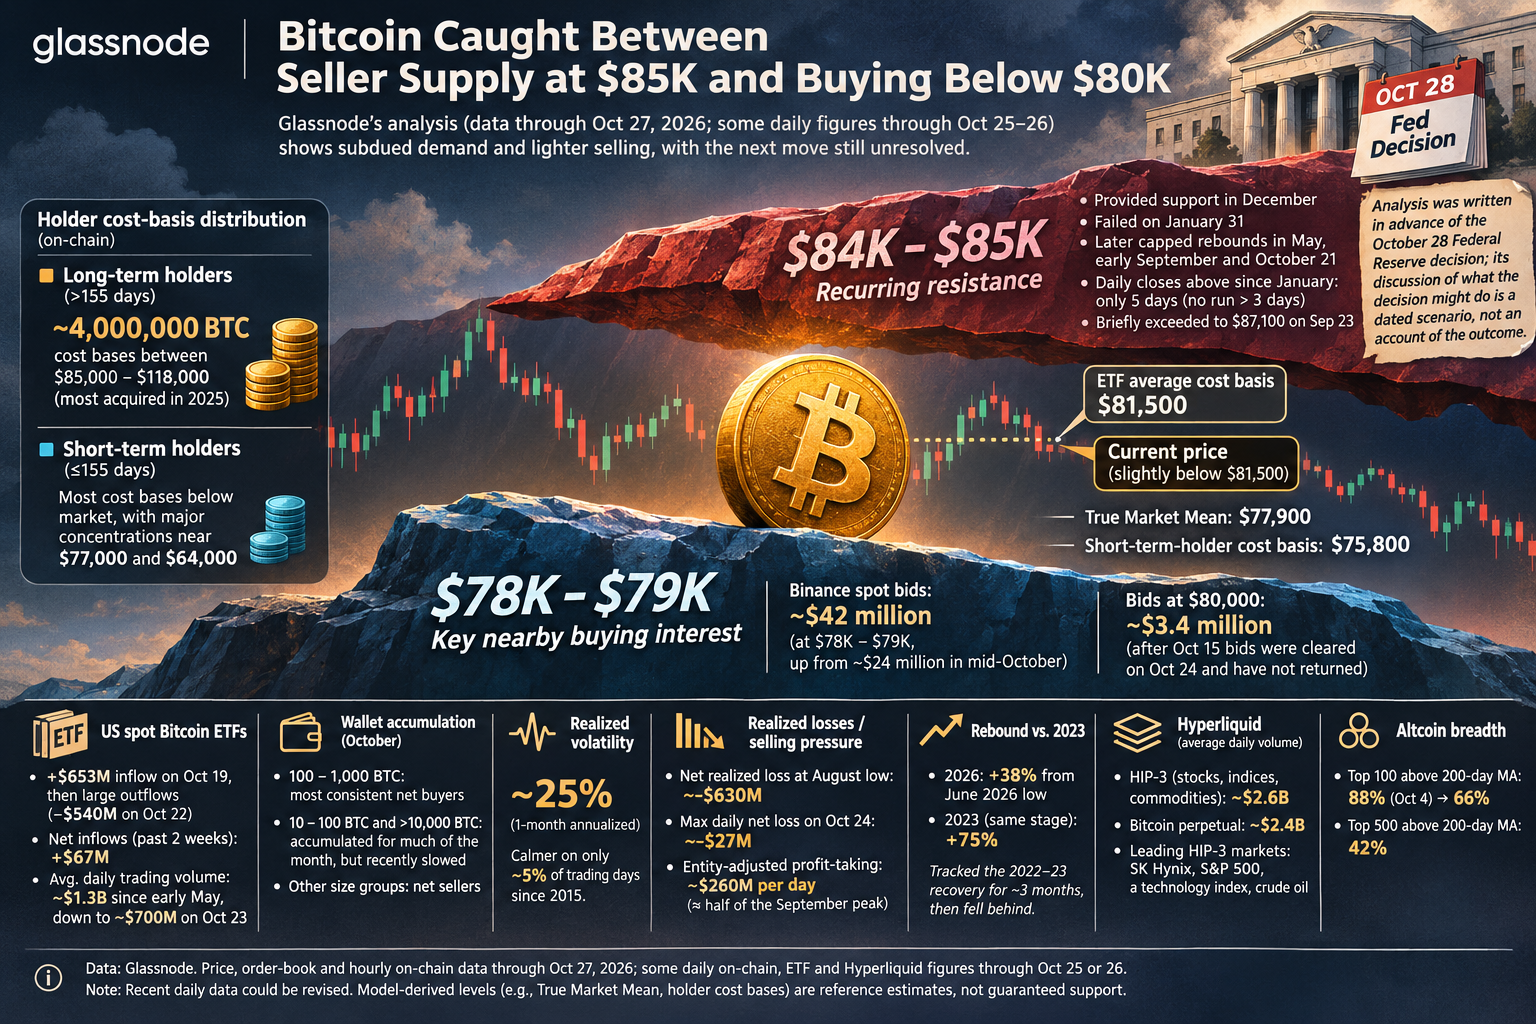
At the report’s measurement point, Bitcoin was slightly below Glassnode’s estimated $81,500 average cost basis for US spot ETF holdings. Its True Market Mean, described as the average cost basis of active investors, stood at $77,900; its short-term-holder cost basis was $75,800. These are model-derived reference levels, not guaranteed support.
Demand was uneven, while measured selling pressure eased
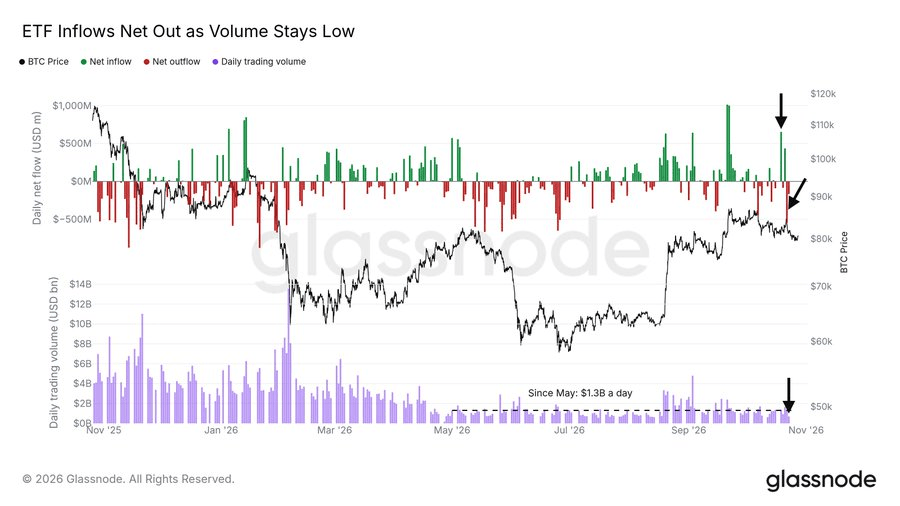
Glassnode reported $653 million of US spot Bitcoin ETF inflows on October 19, followed by substantial outflows, including $540 million on October 22. Net inflows over the preceding two weeks were only $67 million. Average daily ETF trading volume had been around $1.3 billion since early May, and fell to about $700 million on October 23. The combination did not show a sustained return of ETF demand in that period.
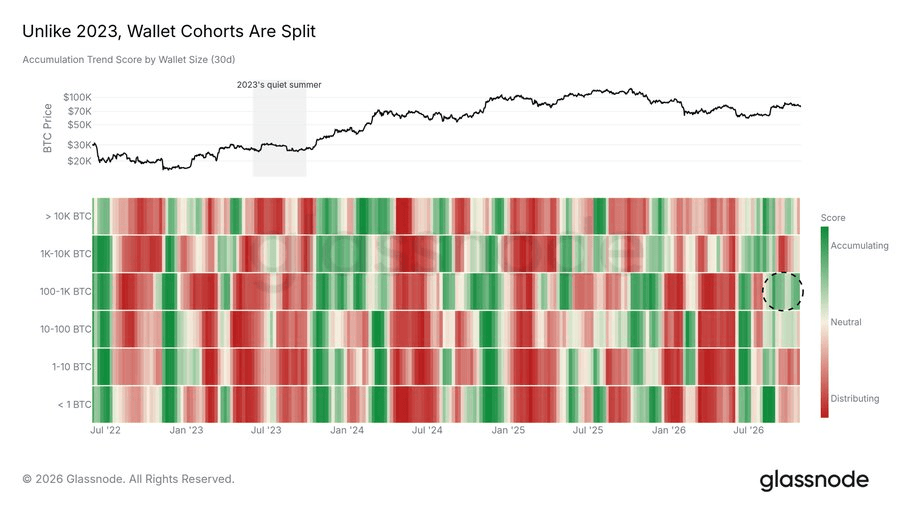
Its Accumulation Trend Score indicated that wallets holding 100–1,000 BTC were the most consistent net buyers during October. Wallets holding 10–100 BTC and more than 10,000 BTC had also accumulated for much of the month but had recently slowed; other size groups were net sellers. Glassnode contrasted that mixed picture with broader selling across wallet groups in summer 2023.
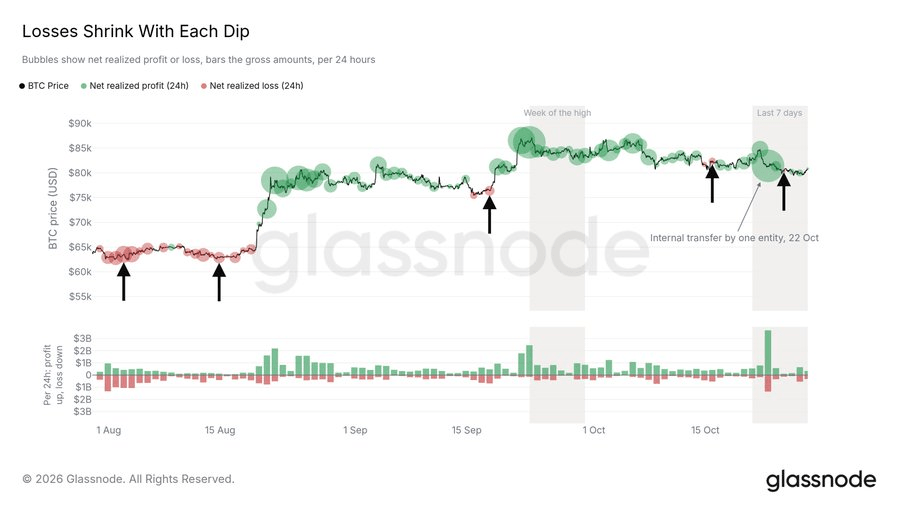
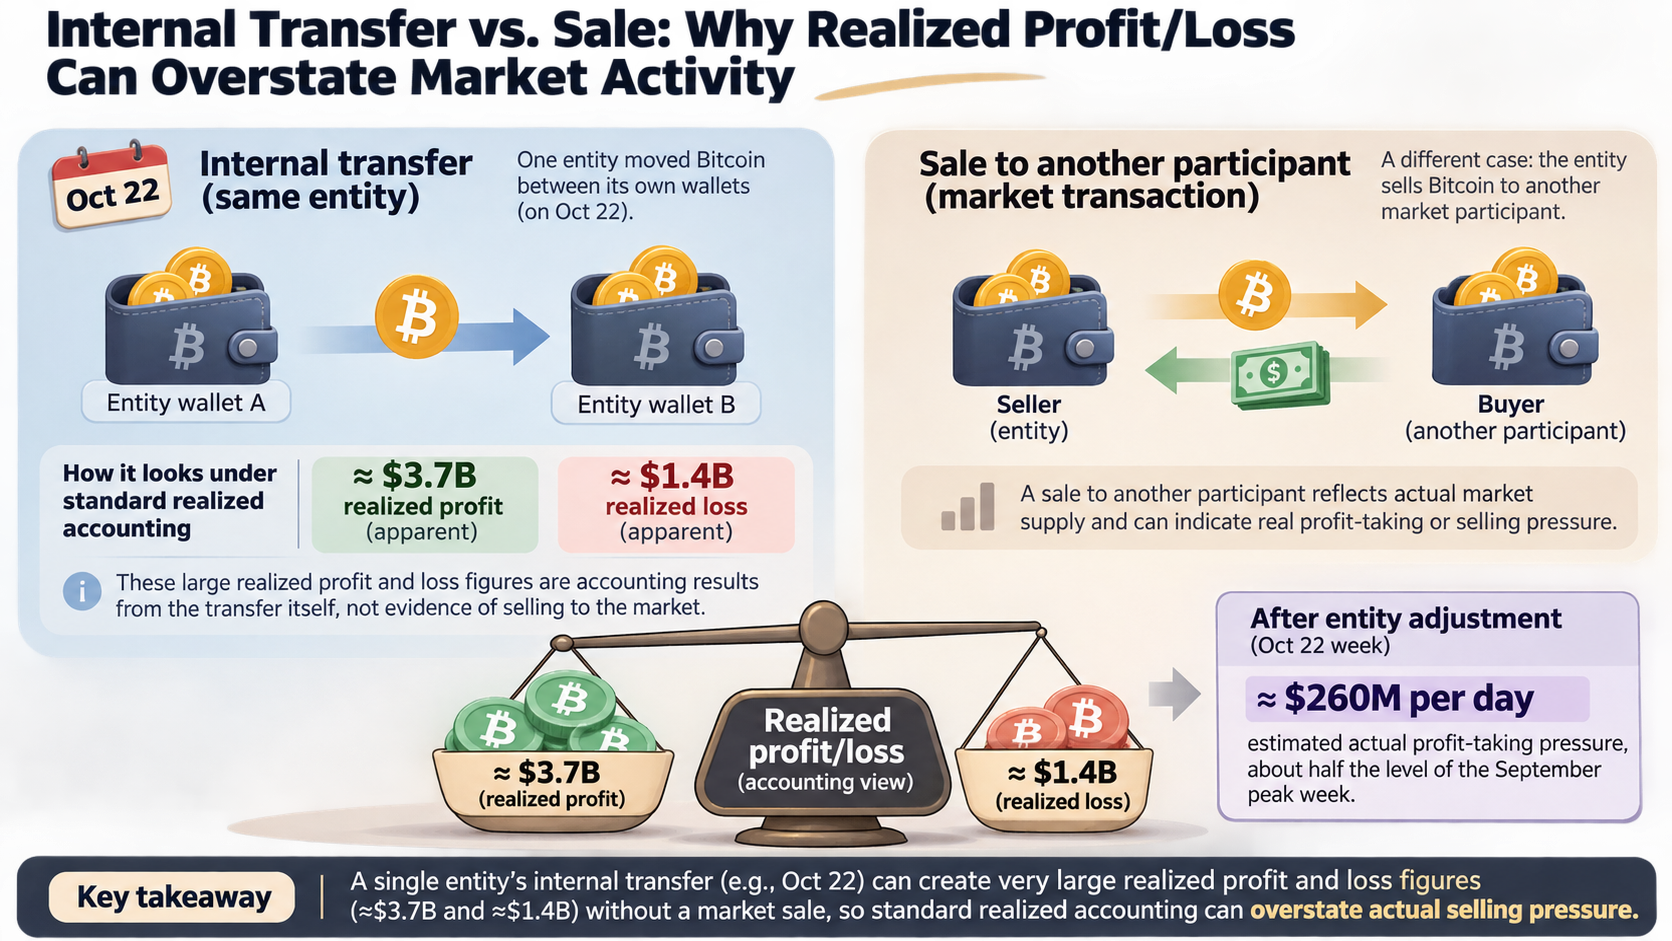
Glassnode said realized losses on successive pullbacks had declined: at an August low, daily realized losses exceeded profits by about $630 million, compared with a maximum daily net loss of about $27 million during the October 24 move lower. It separately flagged an October 22 internal transfer by one entity that, under standard on-chain accounting, generated approximately $3.7 billion in apparent realized profit and $1.4 billion in apparent realized loss without a market sale. After entity adjustment, Glassnode estimated actual profit-taking pressure that week at around $260 million per day, roughly half the level of the September peak week. The distinction matters: a transfer between an entity’s own wallets is not evidence of selling to another market participant.
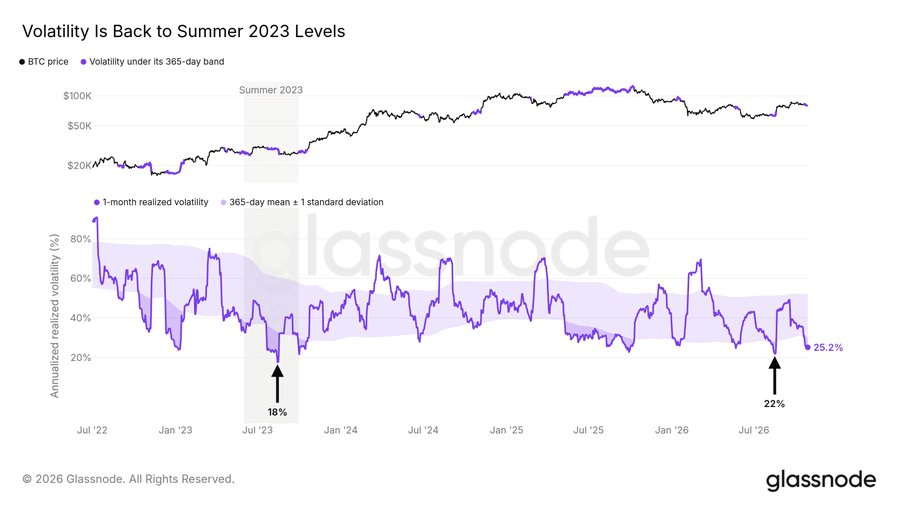
One-month annualized realized volatility had fallen to about 25%. Glassnode said Bitcoin had been calmer on only about 5% of trading days since 2015. Low historical volatility describes the preceding month’s price behavior; by itself, it does not determine the direction of the next move.
The wider market comparison
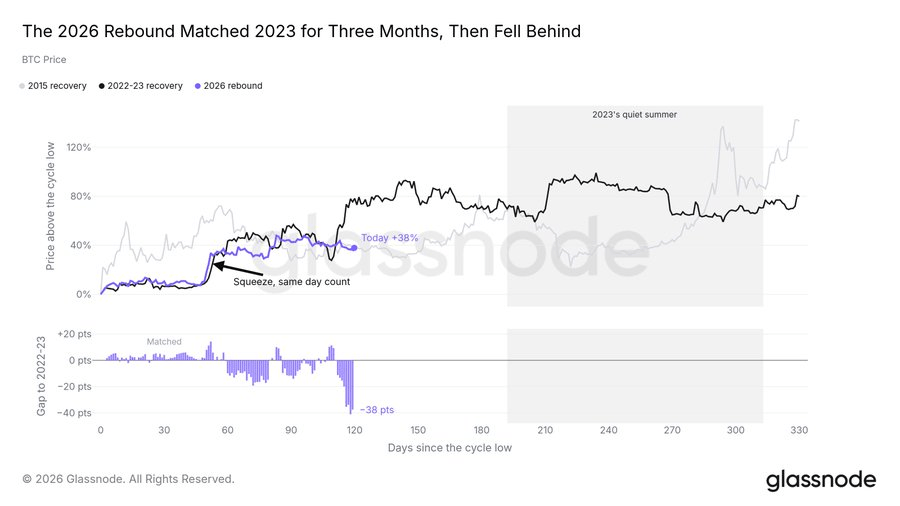
Measured from their respective cycle lows, Glassnode said the 2026 rebound initially tracked the 2022–23 recovery for roughly three months before falling behind. Bitcoin was 38% above its June 2026 low at the report’s measurement point, versus a 75% gain at the comparable stage in 2023. That comparison describes two historical paths, not a forecast.
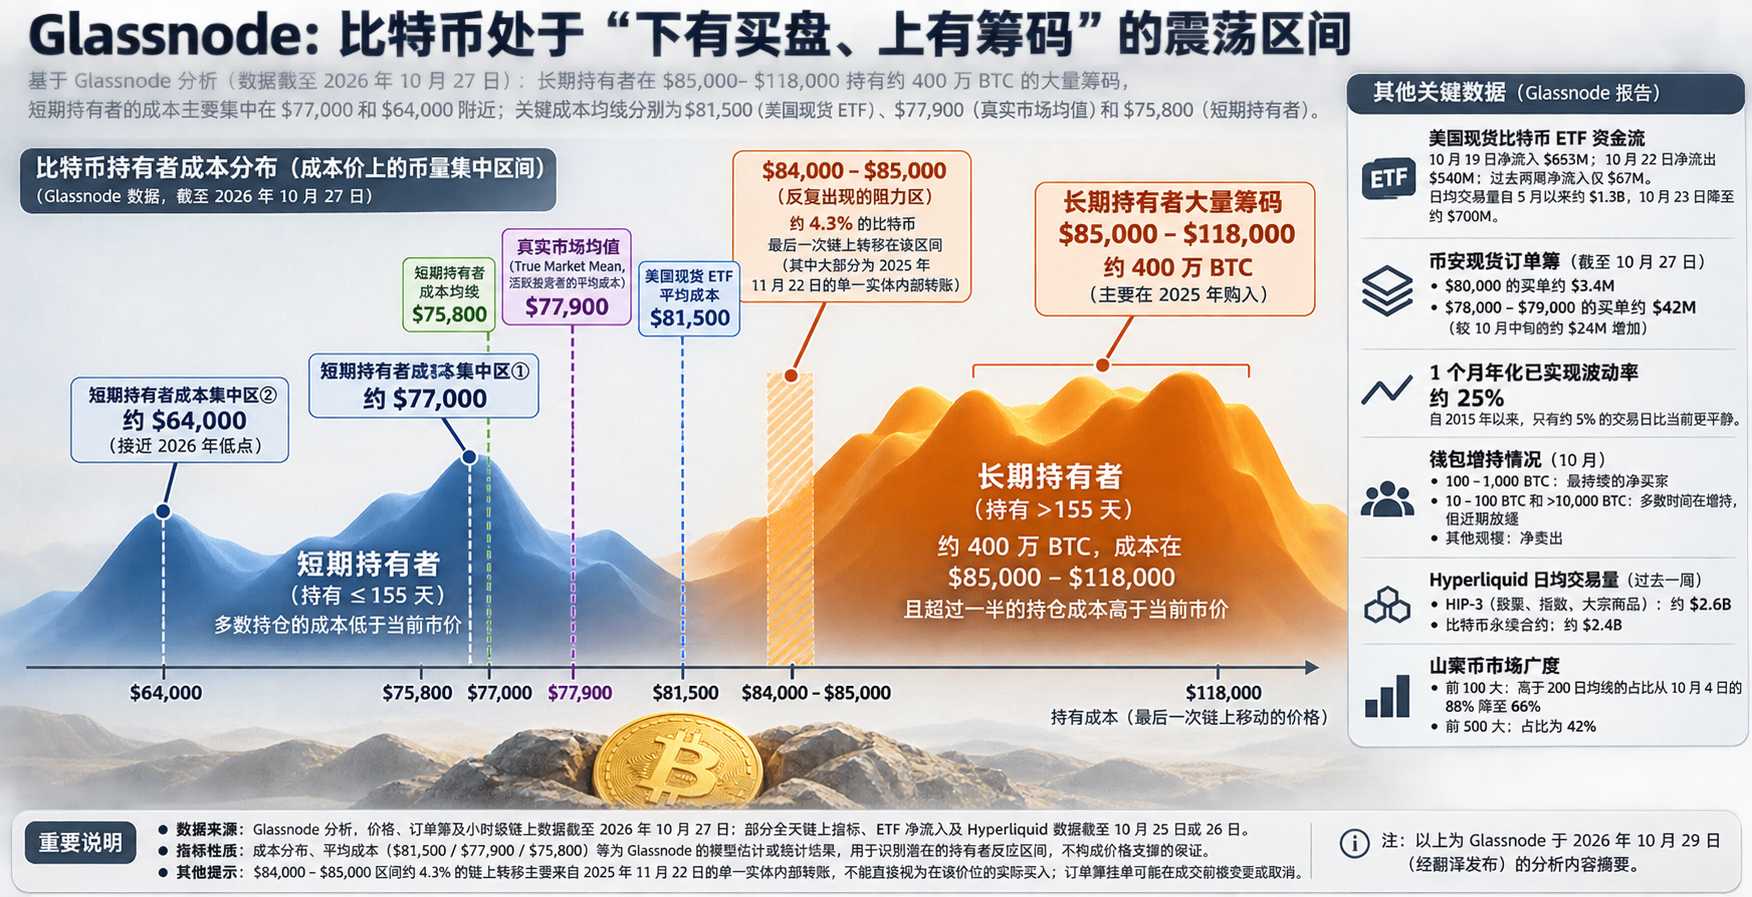
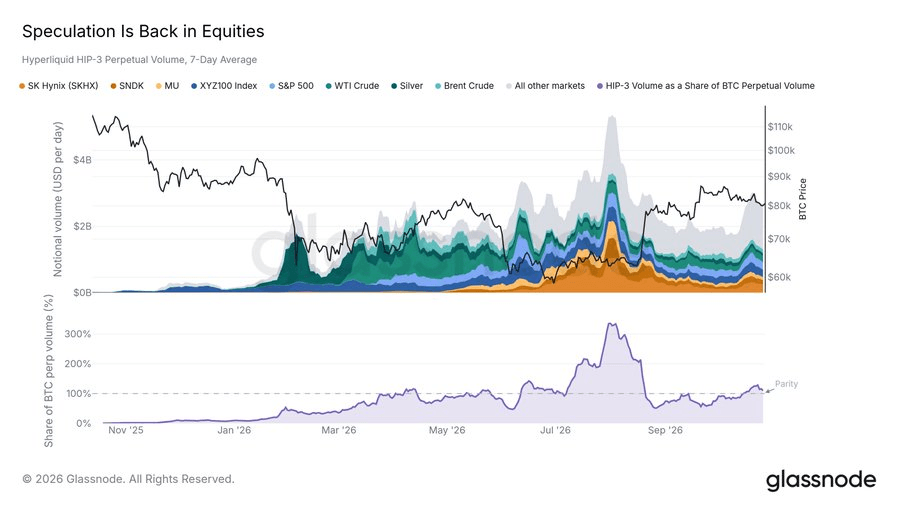
Hyperliquid’s public figures showed average daily volume of about $2.6 billion over the preceding week in its HIP-3 perpetual markets for stocks, indices and commodities, compared with approximately $2.4 billion in its Bitcoin perpetual market. Among the leading HIP-3 markets cited were SK Hynix, the S&P 500, a technology index and crude oil. The comparison is confined to trading on Hyperliquid; it does not measure where all speculative capital went.
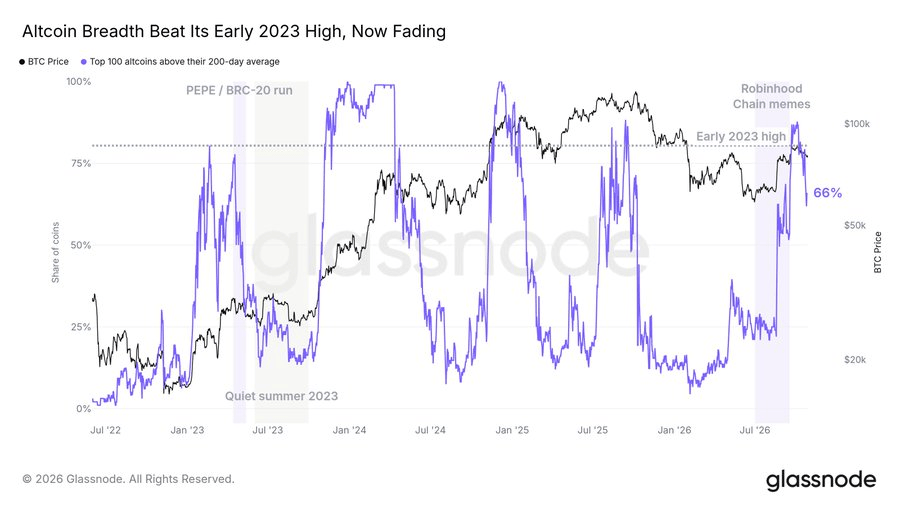
Market breadth had also narrowed. Among the 100 largest altcoins by market value, the share trading above its 200-day moving average fell from 88% on October 4 to 66% at the report’s measurement point. Across the largest 500, the share was 42%. Those figures describe participation in the altcoin advance, not its cause.
Taken together, the data supported Glassnode’s narrower conclusion: ETF demand was subdued and altcoin breadth was weakening, while its entity-adjusted measures did not show a comparable increase in holder selling pressure. Whether the $78,000–$79,000 bids would hold or supply near $85,000 would be absorbed remained unresolved in the data available to the report.